BARE International’s Customer Experience Poll Results: Hospitality

The Results are IN! We surveyed, you voted… From hotel reservation options to ‘Go Green’ initiatives, see who came out on top in BARE International’s Customer Preference Polls: Hospitality.
Thank you for taking part in BARE International’s Customer Preference Polls, which took place over the last few months. So, we wanted to know what is most important to you when it comes to customer experience preferences. We’ve counted and re-counted; your votes have been tallied, and the wait is over! Check out the victorious picks, selected by YOU, from this year’s hospitality preference polls.
Making the Plans
63% of respondents prefer hotels over BnB when it comes to a weekend getaway. (Tweet this)
72% of respondents prefer All-Inclusive when choosing to a vacation over A-La-Carte. (Tweet This)

60% of respondents prefer booking their hotels directly instead of through a third party. (Tweet This)
70% of respondents prefer the human-touch when checking in over self-service check-in. (Tweet this)
Going Green
56% of respondents agree in-room recycling bins as the ‘green’ initiative over refillable body wash dispensers, if they had to choose. (Tweet this)
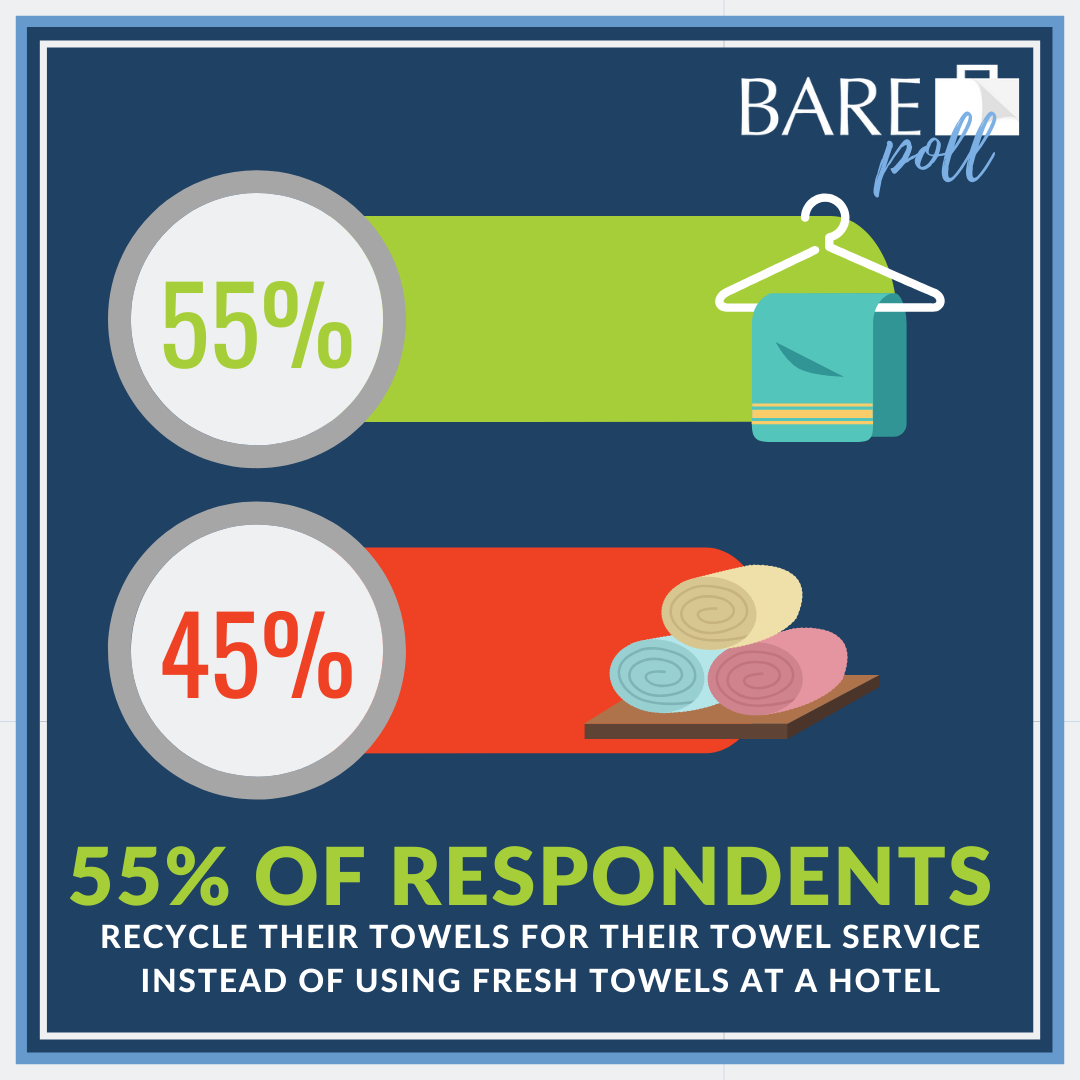
55% of respondents prefer to ‘go green’ and reuse their towels at hotels, versus getting fresh ones daily. (Tweet this)
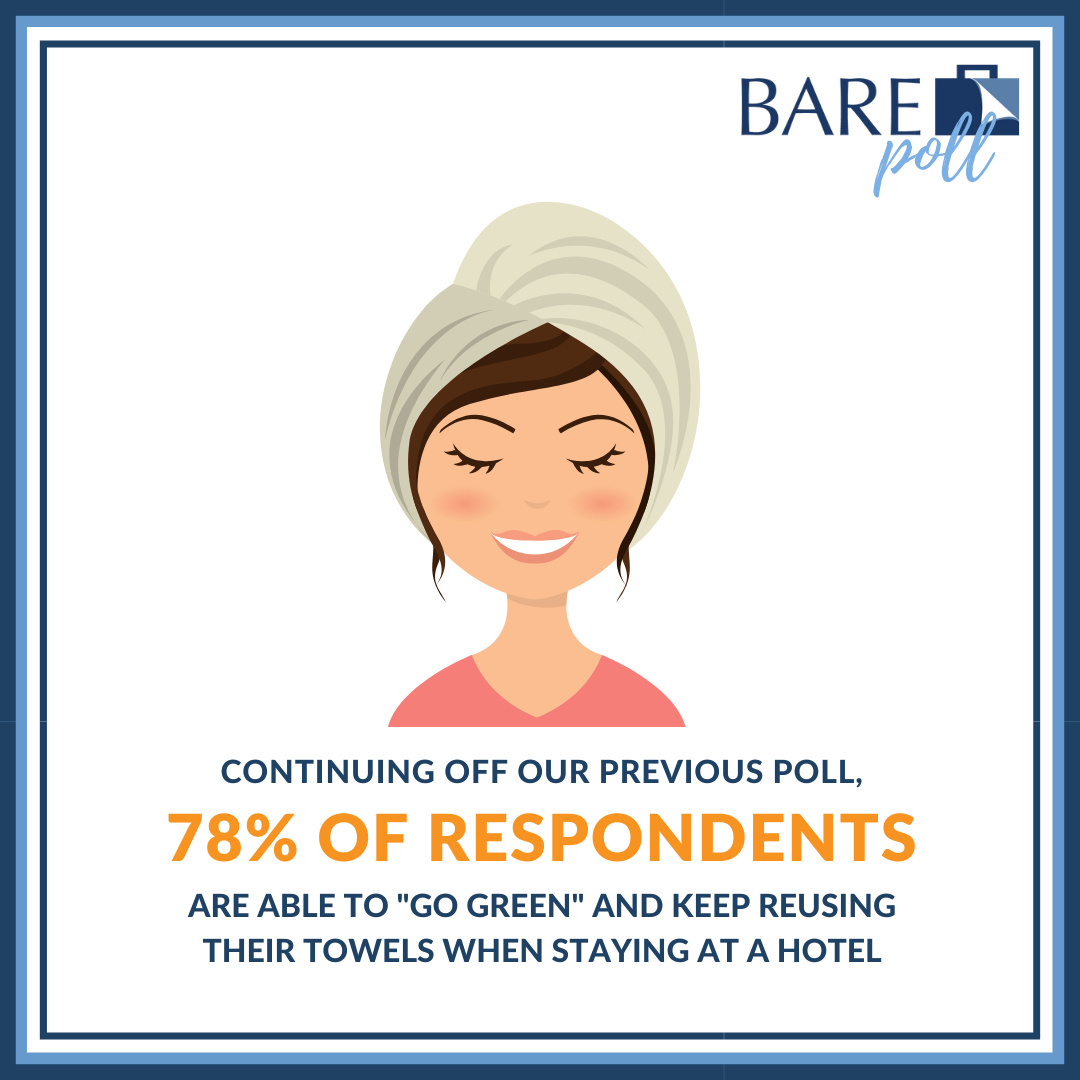
Of the respondents who wanted to reuse their towels, only 78% were able to — the other 22% received fresh towels, regardless of their choice.
During Your Stay
59% of respondents would order breakfast instead of dinner if ordering room service. (Tweet this)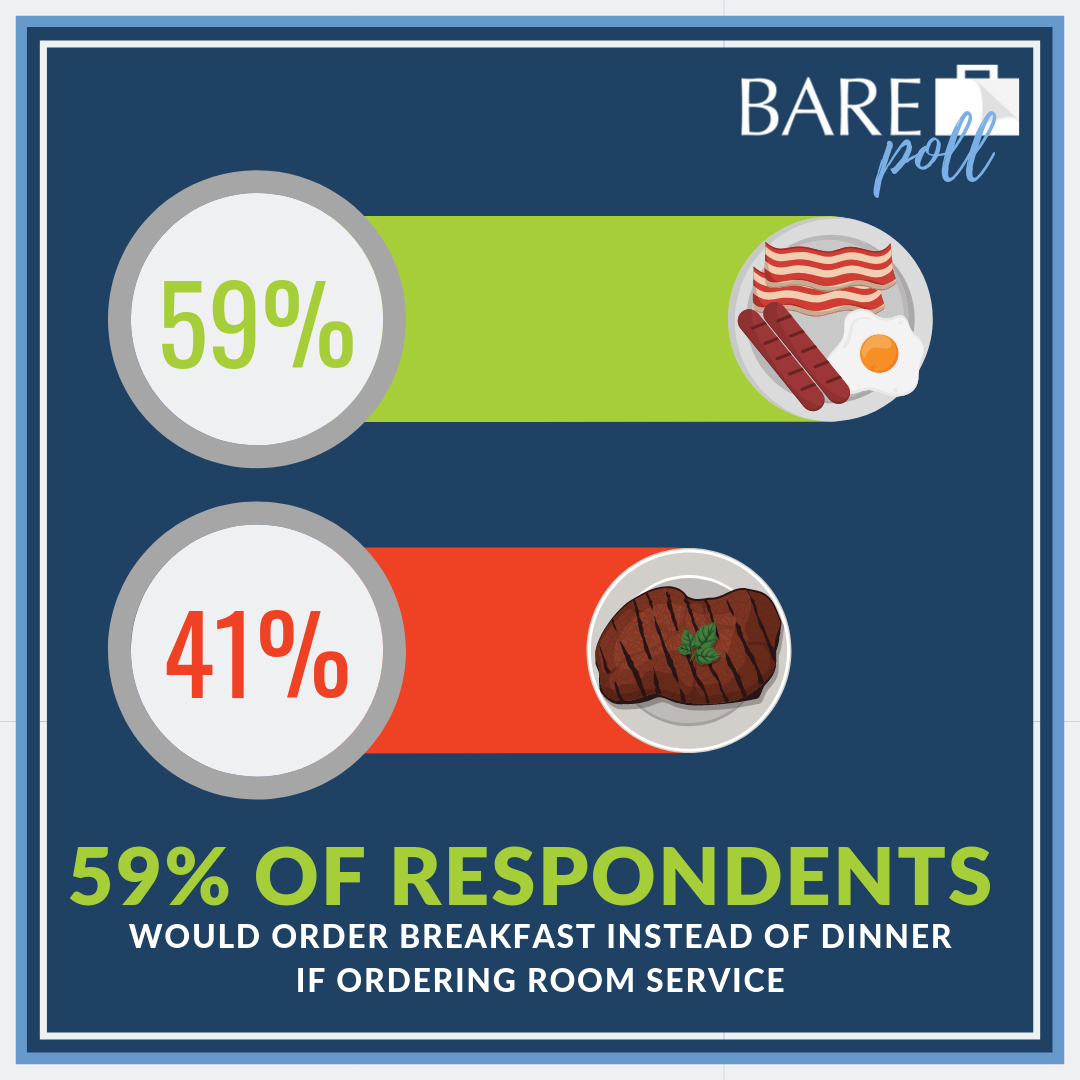
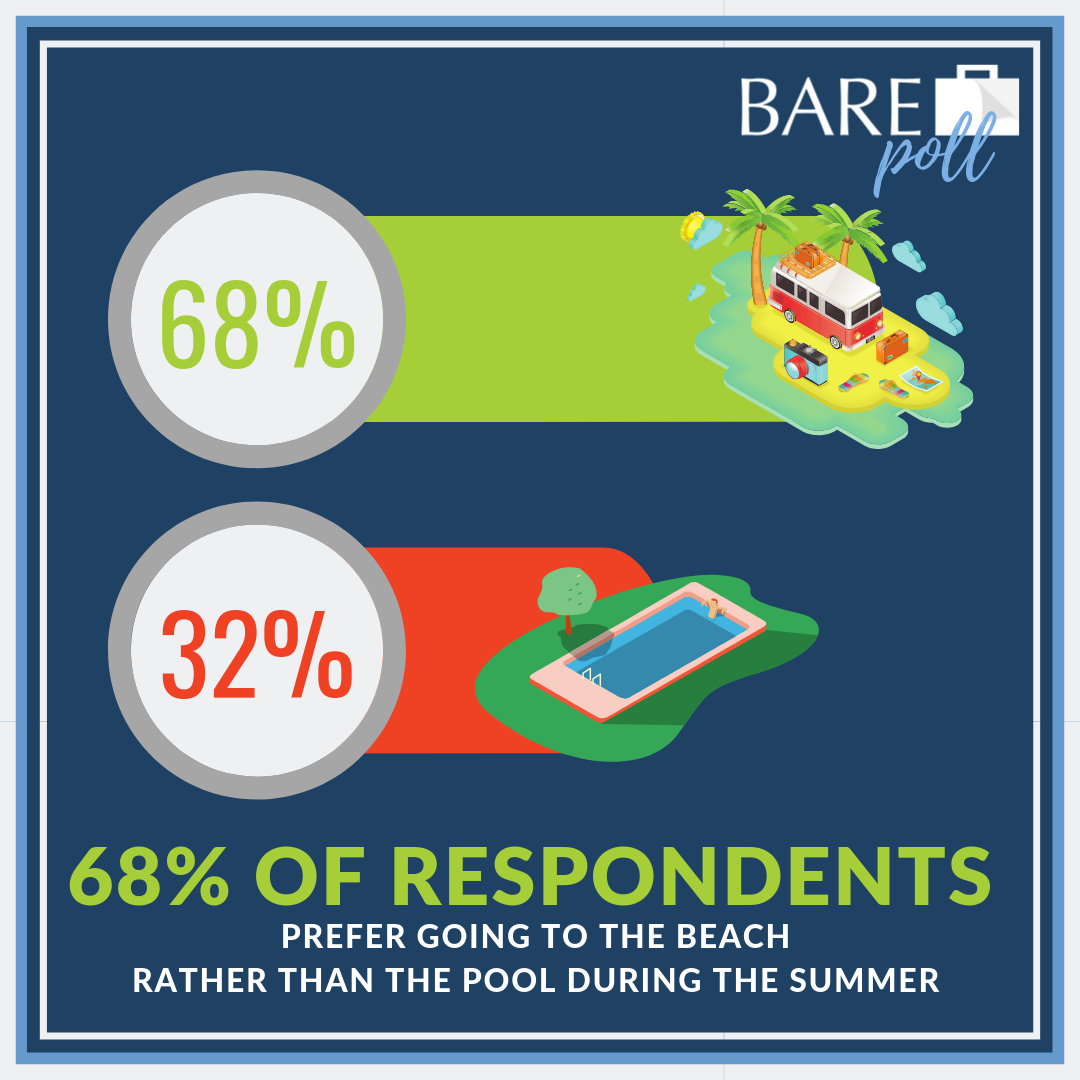
68% of respondents prefer going to the beach rather than the pool during the summer. (Tweet this)
According to our poll, 56% of respondents prefer playing slots over table games at casinos. (Tweet this)
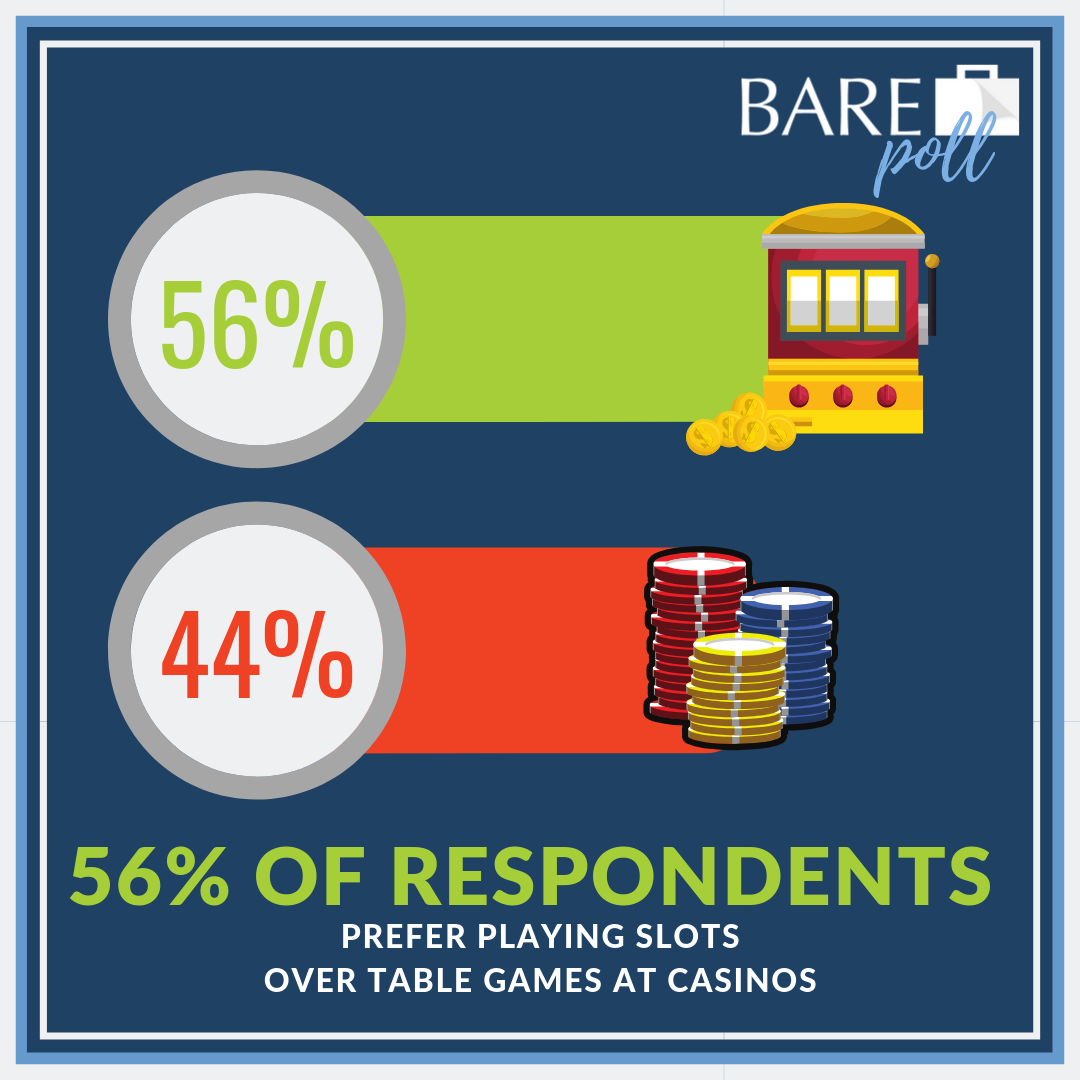
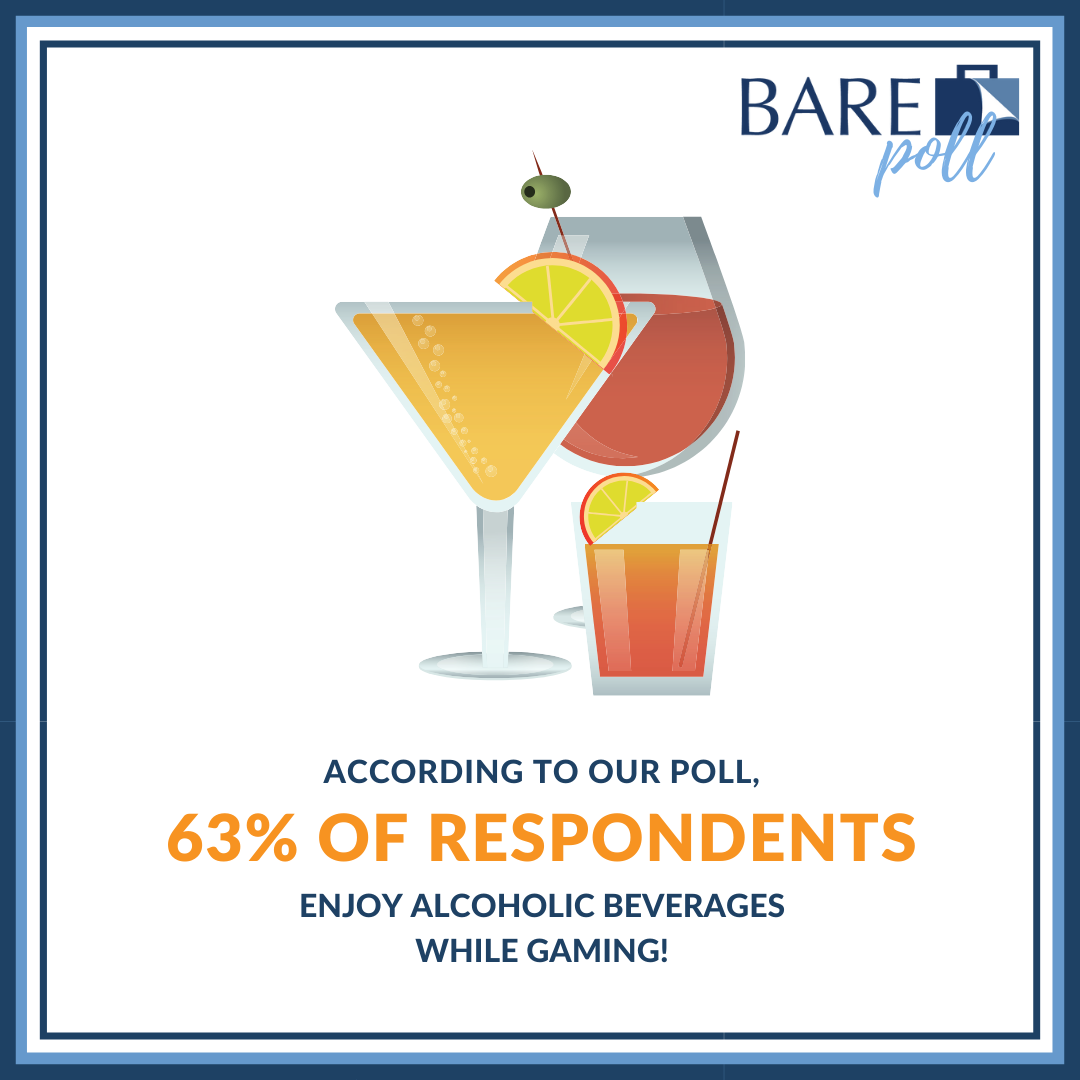
And 63% of respondents enjoy an adult beverage while they play!
Next up: Keep an eye out for our Battle of the Brands Poll Results, coming soon! Check back weekly to vote on our homepage!
BARE polls its website visitors on a weekly basis, unless otherwise noted. For each poll, an average of 1,006 visitors vote during a 7 day period, with a 2.54% conversion of submissions to views.


